THE TRUTH ABOUT RUSSIA’S ECONOMY, DEMOGRAPHICS, BIRTH RATE, MORTALITY RATE, HEALTH AND EDUCATION
The west is using the same strategy with china, who has a worse replacement rate than russia, but even worse, only a fraction of the population lives in cities, and the vast majority of the rest of the population still fails to complete a high school education and lives on subsistence farming in extreme poverty.
Russian Data. While the russian central bank as been oddly honest in their releases, most other parts of the russian government have stopped releasing information to obscure the economic condition. Along the same lines, Russian wiki is like all russian public information about as trustworthy as any other statement made by the russian government – women evolved social warfare by verbal means, the jews adopted it in both abrahamic religions and communist ideology, then the jews via communism taught the soviets, the soviets taught the russian people and now the feminine means of sedition using verbal means of informational deception is the primary method of communication between the russian state and it’s organs and the people. This is why russians are rather interesting in their production of propaganda, fake news, pseudoscience, sophistry and magical thinking. Even if their humor is quite elegant if you understand even a little russian. It’s also why they consider westerners naive and foolish = because we live in a high trust society (or at least did until the postwar takeover of our education by the left in the 1960s).
1) Russian Corruption: Here are some key statistics and indicators related to corruption in Russia:
Corruption Perceptions Index (CPI): In 2022, Russia ranked 137th out of 180 countries on Transparency International’s CPI, with a score of 28 out of 100 (where 0 is highly corrupt and 100 is very clean). This indicates a high perceived level of public sector corruption.
Bribery rates: According to a 2021 survey by the Russian Public Opinion Research Center (VCIOM), 15% of respondents reported having paid a bribe in the past year, while 38% believed that bribery is necessary to solve problems.
Informal payments in healthcare: A 2019 study by the Higher School of Economics found that informal payments for medical services were widespread in Russia, with 27% of patients reporting having made such payments.
Corruption in public procurement: A 2020 report by the Russian Audit Chamber estimated that violations in public procurement amounted to 236 billion rubles (approximately $3.2 billion) in 2019, suggesting significant levels of corruption and misuse of public funds.
Asset disclosure and conflicts of interest: While Russia has laws requiring public officials to disclose their assets and income, enforcement is often weak, and there are concerns about the effectiveness of conflict of interest regulations.
Money laundering and illicit financial flows: Russia has been identified as a high-risk jurisdiction for money laundering and illicit financial flows, with estimates suggesting that billions of dollars are laundered through the country each year.
Perceptions of corruption: In a 2021 survey by the Levada Center, an independent polling organization, 38% of respondents believed that corruption had increased over the past year, while only 13% thought it had decreased.
These statistics highlight the significant challenges posed by corruption in Russia, which affects various aspects of public life, from healthcare and education to business and politics.
3) There are general accounting practices (GAP) that are general across the world, and are adhered to less or more rigorously depending on the transparency of the country and it’s degree of public trust or corruption.
Additionally, there are general accounting practices at global scale to ensure we’re comparing apples to oranges, especially when we are discussing state owned enterprises. The returns on state owned enterprises must be calculated differently when they are included in GDP, GDP Per Capita and GDP/PPP by purchasing power parity.
3) Accounting for State Owned Enterprises: International organizations like the IMF, World Bank, and OECD typically do not include the output of state-owned enterprises directly in their GDP calculations for countries like Russia. Instead, they use a different approach to account for the economic activity of these entities.
In the GDP calculations used by these organizations, government expenditure is shown as a percentage of GDP, which includes the spending of state-owned enterprises.
This approach is based on the System of National Accounts (SNA), an internationally agreed-upon standard for measuring economic activity.
Under the SNA, the output of state-owned enterprises is not counted directly as part of GDP. Instead, the value added by these enterprises is captured through other components of GDP, such as:
– Government expenditure: When state-owned enterprises provide goods or services to the government, their output is reflected in government spending.
– Household consumption: When state-owned enterprises sell goods or services to households, their output is captured in the household consumption component of GDP.
– Investment: If state-owned enterprises invest in capital goods or infrastructure, this is reflected in the investment component of GDP.
By using this approach, the IMF, World Bank, and OECD aim to maintain consistency and comparability in GDP calculations across different countries, regardless of the level of state ownership in their economies.
4. State Owned Enterprises: According to the OECD, in 2016, the share of state-owned enterprises in Russia’s economy was estimated to be around 33% of GDP. This suggests that if the output of these enterprises were directly included in the GDP calculation, Russia’s GDP could potentially be about one-third higher than the currently reported figures.
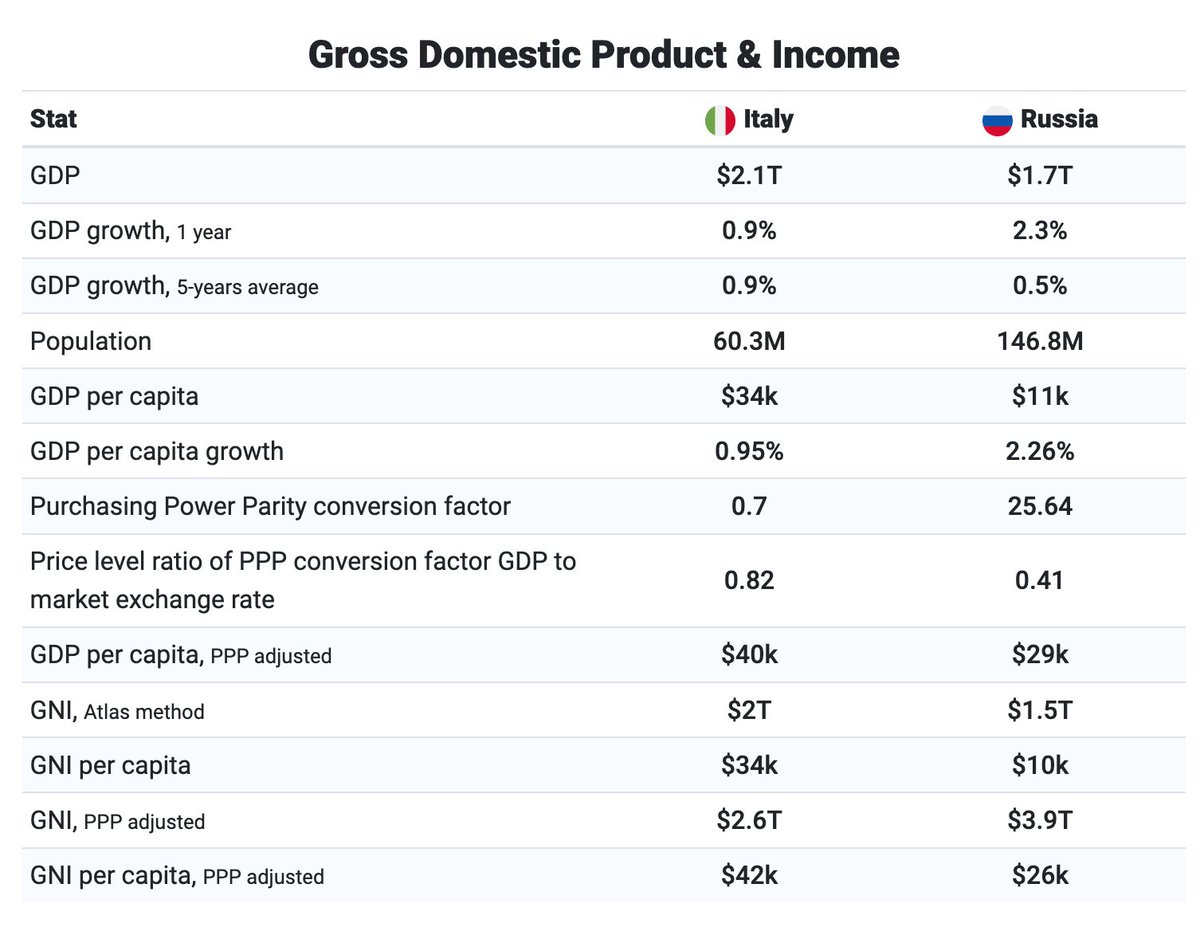
5. To compare Italy’s GDP with Russia’s GDP and Russia’s GDP + 30%, let’s use data from the International Monetary Fund (IMF) for the year 2021. These figures are in current prices and U.S. dollars.
Italy’s GDP (2021): $2,120.22 billion
Russia’s GDP (2021): $1,647.57 billion
Russia’s GDP + 30%: $1,647.57 billion * 1.3 = $2,141.84 billion
Comparing the three figures:
Italy’s GDP is higher than Russia’s reported GDP by approximately $472.65 billion or 28.7%.
If we add 30% to Russia’s GDP (assuming this roughly represents the share of state-owned enterprises), the adjusted figure would be slightly higher than Italy’s GDP by about $21.62 billion or 1.0%.
Now population:
Italy’s population (2021): 59,066,225
Russia’s population (2021): 144,104,080
Ratio = Italy’s population / Russia’s population Ratio = 59,066,225 / 144,104,080 Ratio ≈ 0.41
This means that Italy’s population is approximately 41% the size of Russia’s population, or in other words, Russia’s population is about 2.44 times larger than Italy’s population. Or to put it another way, for every person in Italy, there are roughly 2.44 people in Russia.
So Italy’s GDP per capita would be approximately $35,898.
Russia’s GDP per capita would be approximately $14,863.
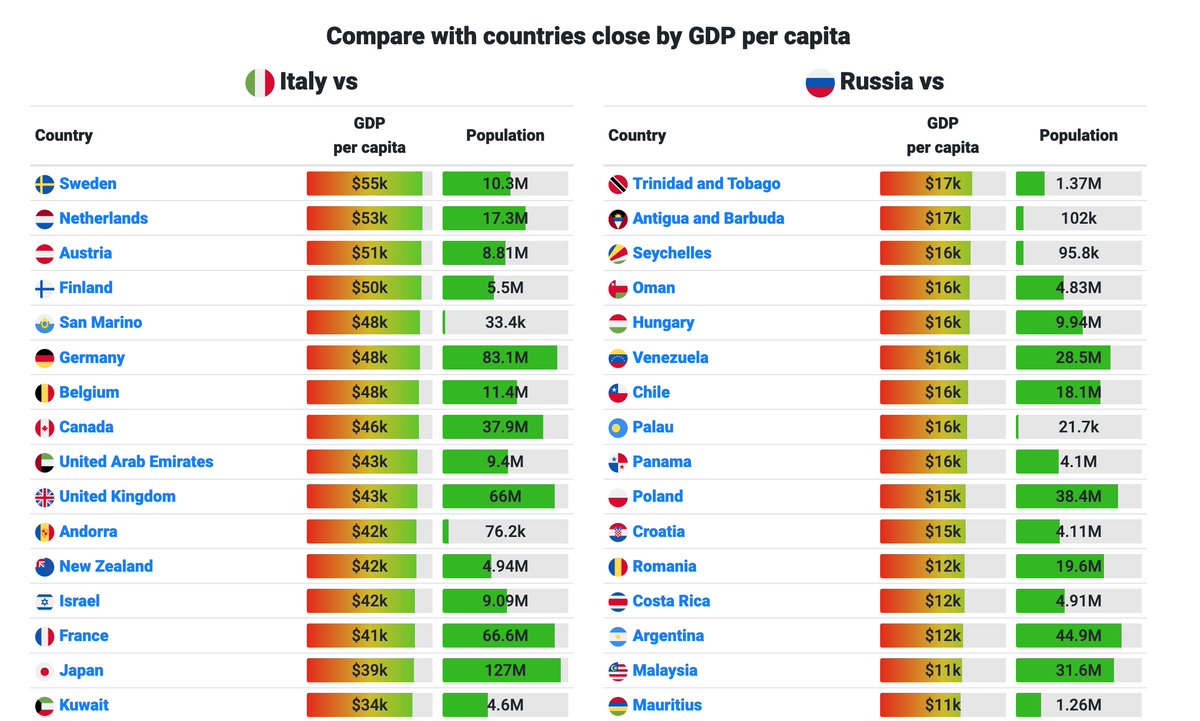
Even with these more charitable numbers, that puts Russia’s economy down there with Mexico, Kazakhstan and nearly as bad as Argentina.
And this is the number show on English wikipedia. So, while the international institutions do produce outputs the rest of the economic world knows how to use and report them.
6. The Fair Comparison: So when those of us who do this kind of thing for a living say “Russia’s economy is smaller than that of Italy or Texas” that’s what we mean. Because that comparison is the most accurate means of conveying Russia’s economic, strategic, and military power, other than the fact that they have nuclear weapons, petroleum, and are willing to throw waves of men as bullet and artillery magnets into quick and painful death by the hundreds of thousands.
7. Russian disregard for human life as military strategy:
If you were a student of military history, the only way russia has ever won wars: by willingness to sacrifice more of their own than any opponent. Which is what they are doing in ukraine, because they assume that the west will ‘lose interest’ before russia has to recruit from moscow and st petersburg which they fear will lead to the uprising that brings down the government.
Unfortunately, you don’t go and threaten half of europe with conquest by braggadocio as if you were some fanatical muslim when you’ve done it before, and so europe is having none of it. And it’s given France, which is the only military power in europe, and Poland which is most likely to fight, the incentive to contain Russia. until it’s demographics and economy catch up with it.
8. Russian Population Collapse: That strategy did work in the past. today it doesnt’. Why? Russian Demographics and Russian Health and Russian High Mortality Rate. Russian IQ flight.
The combination of low fertility and high mortality rates has led to a phenomenon known as “demographic cross,” where the number of deaths exceeds the number of births, leading to natural population decline. This demographic challenge poses significant risks to Russia’s long-term economic and social stability.
Russian Health:
Tuberculosis, HIV/AIDS, Alcohol, and drug use are significant public health issues that contribute to Russia’s high mortality rates.
Tuberculosis (TB): Russia has one of the highest rates of tuberculosis in Europe and the world. According to the World Health Organization (WHO), Russia had an estimated incidence of 50 cases per 100,000 population in 2020. This is significantly higher than the European average of 25 cases per 100,000 population. Russia also has a high prevalence of multi-drug resistant tuberculosis (MDR-TB), which complicates treatment and contributes to higher mortality rates.
HIV/AIDS: Russia has been experiencing a growing HIV epidemic in recent years. According to UNAIDS, in 2020, there were an estimated 1.1 million people living with HIV in Russia, with an adult prevalence rate of 1.2%. The epidemic is primarily driven by injection drug use and heterosexual transmission. The Russian government has been criticized for its insufficient response to the HIV/AIDS epidemic, including limited access to harm reduction services and antiretroviral therapy.
Drug Use: Russia has a significant problem with drug use, particularly injection drug use. According to the United Nations Office on Drugs and Crime (UNODC), in 2019, Russia had an estimated 1.8 million people who inject drugs, which is about 1.3% of the adult population. Injection drug use is a major driver of the HIV epidemic and also contributes to other health problems, such as hepatitis C and overdose deaths.
Alcohol-Attributable Deaths: The WHO estimates that in 2016, alcohol consumption was responsible for 21.6% of all deaths in Russia, which is one of the highest rates globally. This translates to approximately 288,000 alcohol-attributable deaths in that year. The majority of these deaths were due to cardiovascular diseases, injuries, and liver cirrhosis.
Alcohol Use Disorders: According to the Global Burden of Disease Study 2019, the prevalence of alcohol use disorders (AUDs) among adults in Russia was 4.7% (7.9% for males and 1.8% for females). This is higher than the global average of 1.4% and the European average of 3.7%. AUDs include conditions such as alcohol dependence and harmful alcohol use.
Binge Drinking: Binge drinking, defined as consuming 60 or more grams of pure alcohol on at least one occasion in the past 30 days, is a significant problem in Russia. According to the WHO, in 2016, the prevalence of binge drinking among drinkers in Russia was 48.2% (59.1% for males and 32.6% for females). This is one of the highest rates of binge drinking globally.
Homelessness: According to a 2019 report by the Institute for Urban Economics, a Russian think tank, the number of homeless people in Russia is estimated to be between 800,000 and 1.5 million, which is approximately 0.5-1% of the country’s total population. However, some experts suggest that the actual number could be higher, as many homeless individuals may not be included in official statistics. (As any of us watch the number of russians found frozen to death in the snow during the long winters)
Poverty Rate: the Russian poverty rate is $185 per month(2,200 per year), which even at PPP is barely enough to eat. And the poverty rate in the USA per person is $1,132 per month (13,600 per year), and we have SNAP, housing assistance, medicaid etc.
Fertility Rate:
If Russia’s TFR remains at the current low level of 1.5 or declines further, the population decrease means Russia’s population could drop to 128.9 million by 2050 and to 104.3 million by 2100.
The potential consequences of Russia’s population decline include:
– Shrinking labor force and reduced economic output
– Increased strain on social welfare systems, as the population ages
– Reduced geopolitical influence and military power
– Challenges in maintaining infrastructure and social services in regions with declining populations.
Russian High Mortality Rate
According to the World Bank, Russia’s crude death rate (the number of deaths per 1,000 population) has been higher than the global average:
2020: Russia – 14.6, World – 7.6
2019: Russia – 12.4, World – 7.5
2018: Russia – 12.5, World – 7.5
2017: Russia – 12.4, World – 7.5
2016: Russia – 12.9, World – 7.5
Russia’s crude death rate has been consistently higher than the global average by approximately 4-5 deaths per 1,000 population in recent years.
Life Expectancy
Another important indicator of mortality is life expectancy at birth. According to the World Bank, Russia’s life expectancy has been lower than the global average:
2020: Russia – 71.3 years, World – 72.7 years
2019: Russia – 73.1 years, World – 72.7 years
2018: Russia – 72.7 years, World – 72.6 years
2017: Russia – 72.5 years, World – 72.4 years
2016: Russia – 71.9 years, World – 72.2 years
Several factors contribute to Russia’s relatively high mortality rate and lower life expectancy, including:
– High rates of disease
– High rates of injection drug use
– High rates of tobacco and alcohol consumption
– Unhealthy diet and lifestyle choices
– Inadequate access to quality healthcare services
– High rates of accidents and injuries
– Environmental pollution and occupational hazards
Russia’s mortality rate remains a significant concern, especially when combined with its low birth rate.
10. Western Strategy With Russia and China
The NATO strategy, and in particular the british and american (Five Eyes) strategy is just to bleed russia in the current war in ukraine, until time achieves it’s natural result, just as we bled communism until it came to it’s natural conclusion.
The west is usuing the same strategy with china, who has a worse replacement rate than russia, but even worse, only a fraction of the population lives in cities, and the vast majority of the rest of the population still fails to complete a high school education and lives on subsistence farming in extreme poverty.
The only weakness to this strategy is that the feminist revolution in the west has destroyed family, reproduction, dating, and fostered conflict, by supporting left policies (without women voters none of it would have happened) and as such the west is in demographic crisis itself.
We simply don’t know whether the AI revolution is going to mean that’s a good thing because people would be unemployable, or a bad thing, in that we need people anyway.
I hope this was helpful
CD
Reply addressees: @Fixitguy8 @Rsurrection7 @elonmuskADO