photos_and_videos/your_posts/35518930_10156432715572264_4893113273756418048_o_10156432715567264.jpg
Source date (UTC): 2018-06-17 10:07:00 UTC
photos_and_videos/your_posts/35518930_10156432715572264_4893113273756418048_o_10156432715567264.jpg
Source date (UTC): 2018-06-17 10:07:00 UTC
photos_and_videos/your_posts/35479223_10156432715327264_3998436818239356928_o_10156432715322264.jpg
Source date (UTC): 2018-06-17 10:07:00 UTC
photos_and_videos/your_posts/35415383_10156432756787264_957824161374273536_n_10156432756782264.jpg

Source date (UTC): 2018-06-17 09:50:00 UTC
photos_and_videos/your_posts/35472228_10156432756692264_7935320158057267200_n_10156432756687264.jpg
Source date (UTC): 2018-06-17 09:50:00 UTC
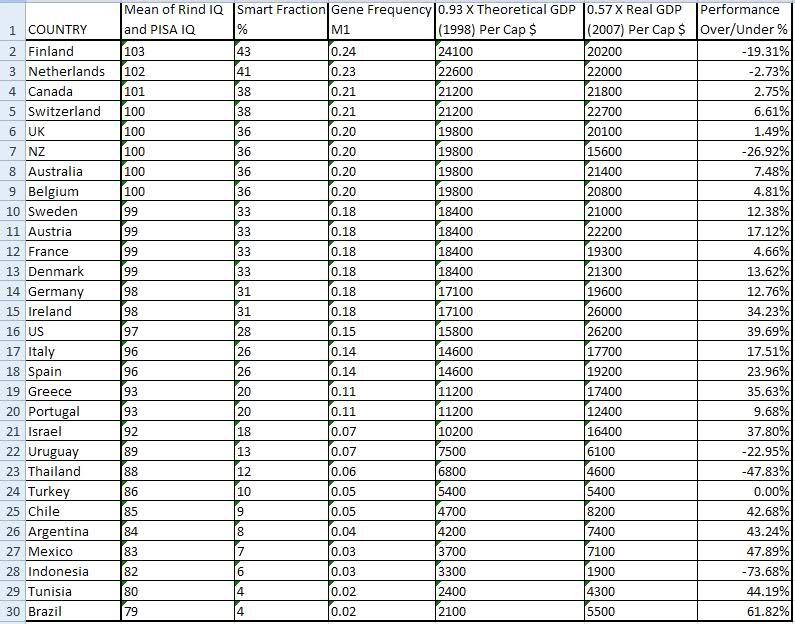
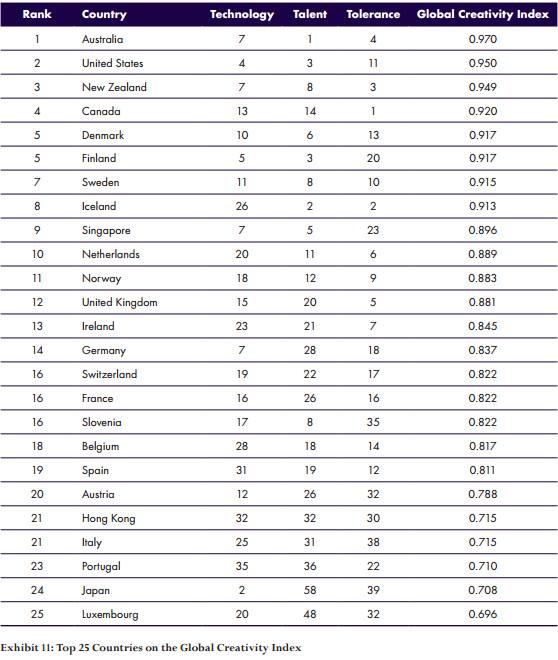
photos_and_videos/your_posts/35507755_10156432756297264_3998798381471236096_n_10156432756292264.jpg Vivek NaWhere is the whole list?Jun 17, 2018 3:01pmCurt Doolittlethe rest don’t matter because if the aren’t on this list then the smart fraction is so small that it’s all but non existent.
That’s the point of understanding how screwed many nations are.Jun 17, 2018 4:24pmCurt DoolittleI mean, what’s interesting is that Ireland and the USA over-perform, and new Zealand and Finland underperform. But I think I understand new zealand and finland (small populations outside core trade routes). I understand why USA and Ireland overperform (tax and legal advantages). Greece overperforms which says something about their genes even if they are a small country. France really does underperform which is due to high unemployment and too much regulation.Jun 17, 2018 4:27pmVik LiYou have Thailand but not China/Korea/Japan?!Jun 19, 2018 5:21amCurt DoolittleAs far as I know the data is from Razib Khan at Gene Expression, and I don’t know why certain countries are included or not – knowing him, it’s probably quality of data.
The article it is from (which seems now lost) was why israel is so relatively poor.
The answer is that Israel is a low trust country.Jun 19, 2018 7:34amGiego CaleiroBrasil has higher average… 85 probablyJun 19, 2018 7:48amCurt DoolittleI suspect this data is from the mid 2000’s.Jun 19, 2018 7:51amPaul OliverYou’re missing Asian countries with smart fractions. Hong Kong? Singapore? Japan? China? Lower standard deviation sure, but the mean boost should still allow a considerable smart fraction. Are you filtering a particular gene?Jun 19, 2018 8:04amCurt DoolittleSee below. I don’t know how he selected which countries to include or not. I do know that some countries are so low that they aren’t included.Jun 19, 2018 8:05amCurt DoolittleThis graph was meant to illustrate the effect of IQ and trust on societies.Jun 19, 2018 8:06amGiego CaleiroIt was higher then. Brazil is the only country where it’s lowering substantially.
Fraction of blacks increasing. Possibly braindrain to pockets of civilization.Jun 19, 2018 8:12amPaul OliverBased on trust, I would expect China would considerably underperform for it’s IQ and Japan to fair quite well. But how do you deduce that trust is the determining factor for performance? Could low trust not also be a consequence of underperformance?Jun 19, 2018 8:33amVivek NaI was curious about Indias over/under performance and %age of smart peopleJun 19, 2018 8:44amBill JoslinThis was ’98?
Canada avg.IQ is now 99. That’s a drop of 2 pointsJun 19, 2018 8:54amAlexander ByronI remember taking PISA test at age 15 in 9th grade, it was somewhat easy.Jun 19, 2018 9:05amPaul TrippWow Chile overperforms. Way to go Pinochet.Jun 19, 2018 9:48pmXenofon KontourisI don’t understand this chart. You mentioned that it is supposed to represent iq and trust in society, but where does it show this? Also the performance over/under index demonstrates what exactly?Jun 20, 2018 1:56amإبراهيم العقيدHoussein تونس هي الدولة العربية الوحيدة هنا !؟
ماذا يعني ذلك حسين، لست متأكدا إذا ما فهمت هذه المؤشرات في هذه الصورة جيدا.
أي سنة هذه الإحصائيات ؟Jun 20, 2018 9:39amHoussein Ben Bdiraحتى اني مفهمتش هذا الجدول .Jun 20, 2018 9:50am
Source date (UTC): 2018-06-17 09:50:00 UTC
photos_and_videos/Intelligence_10156432685457264/35464244_10156432756877264_2802080846238973952_n_10156432756872264.jpg
Source date (UTC): 2018-06-17 09:50:00 UTC
photos_and_videos/Intelligence_10156432685457264/35507750_10156432756932264_127788140483051520_o_10156432756922264.jpg
Source date (UTC): 2018-06-17 09:50:00 UTC
photos_and_videos/Intelligence_10156432685457264/35434963_10156432756837264_213930590141939712_n_10156432756832264.jpg
Source date (UTC): 2018-06-17 09:50:00 UTC
photos_and_videos/Intelligence_10156432685457264/35534089_10156432756777264_7334380660557086720_n_10156432756772264.jpg
Source date (UTC): 2018-06-17 09:50:00 UTC
photos_and_videos/Intelligence_10156432685457264/35415383_10156432756787264_957824161374273536_n_10156432756782264.jpg
Source date (UTC): 2018-06-17 09:50:00 UTC